How much memory GitRiver uses, what load a single node handles and where saturation begins — every number measured on a dedicated machine
Every number here comes from a run on the hardware listed below, not from an estimate: the harness brings up an installation, seeds it with the data listed below and drives the scenarios to saturation.
Test environment
| Parameter |
Value |
| GitRiver version |
1.1.0 |
| Run date |
2026-09-17 |
| CPU |
Intel(R) Xeon(R) CPU E5-2667 v4 @ 3.20GHz (16 threads) |
| RAM |
94 GB |
| Storage |
NVMe SSD, btrfs |
| Kernel |
Linux 7.2.4 |
| PostgreSQL |
18.6 |
| Build profile |
release |
| Run conditions |
dedicated machine, all other load stopped |
| Server binary size |
57.2 MB |
Seed data:
| Entity |
Count |
| Users |
1 000 |
| Repositories |
10 000 |
| Issues |
100 000 |
| Activity records |
100 000 |
| Pull requests |
100 000 |
| Reviews |
200 000 |
| Review requests |
100 000 |
| Pull request assignees |
100 000 |
| Repository directory (on disk) |
1.45 GB |
| Database |
247.2 MB |
The load client and the server run on the same machine: the network is excluded from the measurement, but they share CPU time. The request rate limit is lifted for the duration of the run — otherwise the write scenarios would measure the rate limiter, not the server.
Memory at idle
The server runs with the seeded database and its background jobs active, serving no requests. After startup there is a 30-second wait, then a 60-second measurement window; the table records the peak over that window, not a lucky instant.
| Metric |
Value |
| Resident memory at idle |
45.8 MB |
| Binary size |
57.2 MB |
Scenario summary
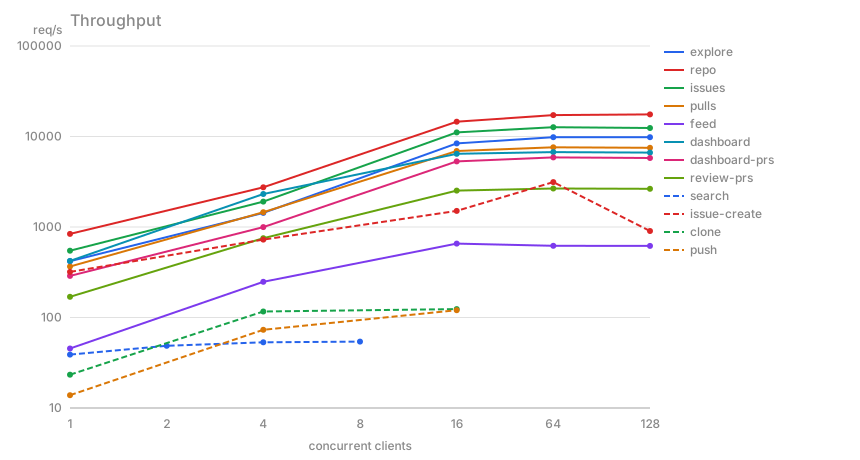
For each scenario the table takes the step with the highest throughput among the runs that produced no failures at all — that is, the regime before the breaking point, not past it. The full step series are below.
| Scenario |
Call |
Conc. |
req/s |
p50, ms |
p95, ms |
p99, ms |
Errors |
Peak memory |
| Repository explore |
GET /api/v1/explore |
128 |
9821.75 |
12.87 |
16.76 |
18.9 |
0 |
71.1 MB |
| Repository page |
GET /api/v1/repos/{owner}/{name} |
128 |
17554.9 |
7.23 |
10.18 |
11.86 |
0 |
71.5 MB |
| Issue list |
GET /api/v1/repos/{owner}/{name}/issues |
64 |
12657.5 |
4.91 |
7.54 |
9.31 |
0 |
67.2 MB |
| Repository pull requests |
GET /api/v1/repos/{owner}/{name}/pull_requests |
64 |
7602.8 |
8.29 |
10.51 |
11.93 |
0 |
280.9 MB |
| Activity feed |
GET /api/v1/activity |
16 |
654.7 |
24.15 |
27.59 |
29.75 |
0 |
202.7 MB |
| Dashboard summary |
GET /api/v1/dashboard/stats |
64 |
6719.45 |
9.42 |
11.26 |
12.33 |
0 |
300.4 MB |
| My pull requests |
GET /api/v1/dashboard/prs |
64 |
5876.8 |
10.68 |
14.24 |
16.2 |
0 |
261.1 MB |
| Pull requests to review |
GET /api/v1/dashboard/review-prs |
64 |
2664.35 |
23.64 |
30.17 |
33.9 |
0 |
225.2 MB |
| Code search |
GET /api/v1/search/code |
8 |
54.2 |
145.16 |
177.7 |
195.68 |
0 |
187.4 MB |
| Issue creation |
POST /api/v1/repos/{owner}/{name}/issues |
64 |
3136.55 |
16.2 |
59.41 |
105.9 |
0 |
318.9 MB |
| Clone (git clone) |
git clone http://…/{owner}/{name} |
16 |
123.85 |
129.08 |
146.56 |
156.25 |
0 |
51.0 MB |
| Push (git push) |
git push http://…/{owner}/{name} |
16 |
120.35 |
131.72 |
164.75 |
180.27 |
0 |
208.1 MB |
Single-client response
The bottom step of every series: one client, no queue. This is the cost of the call itself — what a person waits for when opening a page on an idle node.
Each scenario is preceded by a separate warm-up pass whose result is discarded: otherwise the bottom step would measure the first read from disk rather than the server.
| Scenario |
p50, ms |
p95, ms |
p99, ms |
req/s |
| Repository explore |
2.48 |
2.68 |
3.09 |
418.55 |
| Repository page |
1.22 |
1.4 |
1.51 |
838.2 |
| Issue list |
1.86 |
2.24 |
2.37 |
546.55 |
| Repository pull requests |
2.79 |
3.16 |
3.36 |
366.5 |
| Activity feed |
22.05 |
24.28 |
25.28 |
45.4 |
| Dashboard summary |
2.43 |
2.8 |
2.97 |
422.55 |
| My pull requests |
3.61 |
3.91 |
4.46 |
287.9 |
| Pull requests to review |
5.95 |
7.33 |
8 |
169.4 |
| Code search |
25.58 |
27.56 |
28.97 |
38.95 |
| Issue creation |
2.79 |
4.12 |
4.81 |
319.35 |
| Clone (git clone) |
43.16 |
47.58 |
50.5 |
23.35 |
| Push (git push) |
58.56 |
95.36 |
105.07 |
13.85 |
Saturation behaviour
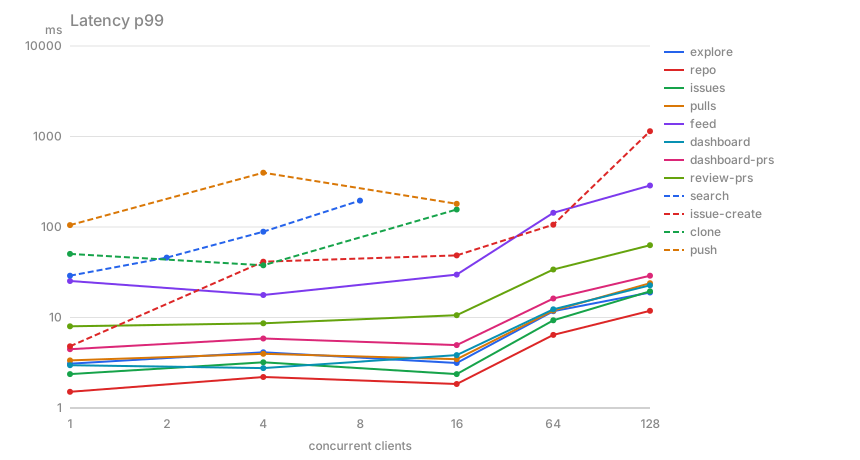
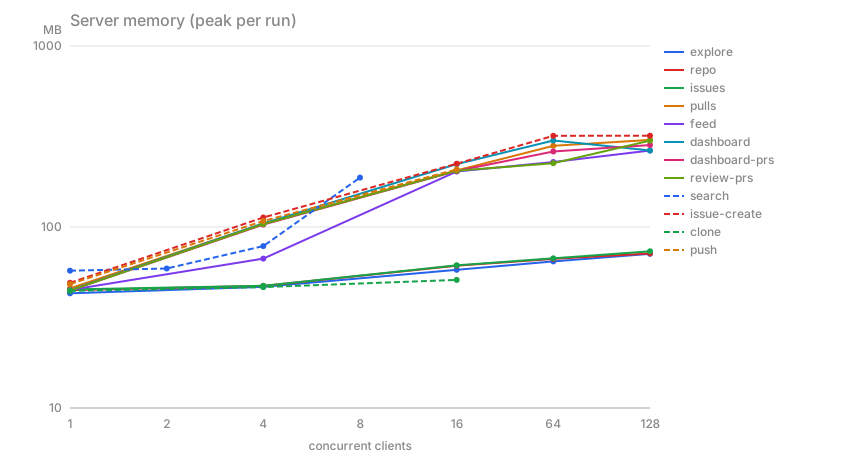
Every scenario is run at several concurrency levels. While throughput keeps growing the server is not saturated; the knee of the curve together with a rising p99 marks the saturation point. Both axes are logarithmic.
Repository explore
| Conc. |
req/s |
p50, ms |
p95, ms |
p99, ms |
max, ms |
Errors |
CPU, % of a core |
Peak memory |
| 1 |
418.55 |
2.48 |
2.68 |
3.09 |
5 |
0 |
39.7 |
43.0 MB |
| 4 |
1431.9 |
2.81 |
3.69 |
4.13 |
10.54 |
0 |
145.95 |
46.7 MB |
| 16 |
8391.4 |
1.84 |
2.69 |
3.14 |
10.13 |
0 |
480.55 |
58.0 MB |
| 64 |
9812.5 |
6.34 |
9.86 |
11.74 |
21 |
0 |
580.4 |
64.6 MB |
| 128 |
9821.75 |
12.87 |
16.76 |
18.9 |
29.73 |
0 |
587.55 |
71.1 MB |
Repository page
| Conc. |
req/s |
p50, ms |
p95, ms |
p99, ms |
max, ms |
Errors |
CPU, % of a core |
Peak memory |
| 1 |
838.2 |
1.22 |
1.4 |
1.51 |
4.88 |
0 |
58.9 |
44.8 MB |
| 4 |
2745.35 |
1.45 |
1.97 |
2.2 |
7.16 |
0 |
230.95 |
47.2 MB |
| 16 |
14554.65 |
1.06 |
1.53 |
1.84 |
5.63 |
0 |
695.8 |
61.1 MB |
| 64 |
17247.5 |
3.65 |
5.44 |
6.42 |
14.7 |
0 |
870.9 |
66.7 MB |
| 128 |
17554.9 |
7.23 |
10.18 |
11.86 |
22.66 |
0 |
899.7 |
71.5 MB |
Issue list
| Conc. |
req/s |
p50, ms |
p95, ms |
p99, ms |
max, ms |
Errors |
CPU, % of a core |
Peak memory |
| 1 |
546.55 |
1.86 |
2.24 |
2.37 |
4.22 |
0 |
57 |
45.2 MB |
| 4 |
1909.85 |
2.09 |
2.83 |
3.2 |
13.95 |
0 |
215.95 |
47.4 MB |
| 16 |
11096.6 |
1.39 |
1.98 |
2.37 |
9.03 |
0 |
672.4 |
61.4 MB |
| 64 |
12657.5 |
4.91 |
7.54 |
9.31 |
18.43 |
0 |
808.9 |
67.2 MB |
| 128 |
12408.8 |
9.93 |
15.2 |
19.46 |
27.94 |
0 |
808.7 |
73.4 MB |
Repository pull requests
| Conc. |
req/s |
p50, ms |
p95, ms |
p99, ms |
max, ms |
Errors |
CPU, % of a core |
Peak memory |
| 1 |
366.5 |
2.79 |
3.16 |
3.36 |
9.71 |
0 |
63.1 |
45.9 MB |
| 4 |
1457.05 |
2.78 |
3.6 |
3.97 |
7.18 |
0 |
241.8 |
104.4 MB |
| 16 |
6916.15 |
2.26 |
3.02 |
3.46 |
6.78 |
0 |
563.65 |
205.6 MB |
| 64 |
7602.8 |
8.29 |
10.51 |
11.93 |
19.29 |
0 |
660.3 |
280.9 MB |
| 128 |
7503.45 |
16.75 |
20.53 |
23.93 |
35.38 |
0 |
661.95 |
303.0 MB |
Activity feed
| Conc. |
req/s |
p50, ms |
p95, ms |
p99, ms |
max, ms |
Errors |
CPU, % of a core |
Peak memory |
| 1 |
45.4 |
22.05 |
24.28 |
25.28 |
26.42 |
0 |
14.05 |
44.9 MB |
| 4 |
248.2 |
16.07 |
17.22 |
17.73 |
19.38 |
0 |
44.1 |
66.9 MB |
| 16 |
654.7 |
24.15 |
27.59 |
29.75 |
38.53 |
0 |
148.75 |
202.7 MB |
| 64 |
620.4 |
103.22 |
130.94 |
143.66 |
171.09 |
0 |
158.9 |
228.6 MB |
| 128 |
617.55 |
208.46 |
264.79 |
287.71 |
335.49 |
0 |
167.55 |
264.8 MB |
Dashboard summary
| Conc. |
req/s |
p50, ms |
p95, ms |
p99, ms |
max, ms |
Errors |
CPU, % of a core |
Peak memory |
| 1 |
422.55 |
2.43 |
2.8 |
2.97 |
7.3 |
0 |
60 |
44.8 MB |
| 4 |
2316.1 |
1.66 |
2.4 |
2.76 |
4.23 |
0 |
230.75 |
104.6 MB |
| 16 |
6438.4 |
2.43 |
3.32 |
3.84 |
8.34 |
0 |
428.4 |
222.5 MB |
| 64 |
6719.45 |
9.42 |
11.26 |
12.33 |
16.88 |
0 |
467.6 |
300.4 MB |
| 128 |
6636.15 |
19.16 |
21.36 |
22.71 |
28.45 |
0 |
471.4 |
264.8 MB |
My pull requests
| Conc. |
req/s |
p50, ms |
p95, ms |
p99, ms |
max, ms |
Errors |
CPU, % of a core |
Peak memory |
| 1 |
287.9 |
3.61 |
3.91 |
4.46 |
15.88 |
0 |
45.25 |
44.7 MB |
| 4 |
996.75 |
4.06 |
5.28 |
5.86 |
7.45 |
0 |
163.6 |
103.1 MB |
| 16 |
5311.2 |
2.9 |
4.23 |
4.96 |
23.87 |
0 |
432.85 |
204.3 MB |
| 64 |
5876.8 |
10.68 |
14.24 |
16.2 |
24.55 |
0 |
497.7 |
261.1 MB |
| 128 |
5779.9 |
21.85 |
26.16 |
28.98 |
40.43 |
0 |
498.45 |
283.8 MB |
Pull requests to review
| Conc. |
req/s |
p50, ms |
p95, ms |
p99, ms |
max, ms |
Errors |
CPU, % of a core |
Peak memory |
| 1 |
169.4 |
5.95 |
7.33 |
8 |
19.11 |
0 |
34.2 |
44.6 MB |
| 4 |
752.95 |
5.25 |
7.6 |
8.63 |
14.24 |
0 |
129.85 |
103.8 MB |
| 16 |
2525.05 |
6.15 |
9.06 |
10.6 |
20.43 |
0 |
257.25 |
204.6 MB |
| 64 |
2664.35 |
23.64 |
30.17 |
33.9 |
44.15 |
0 |
283.7 |
225.2 MB |
| 128 |
2640.3 |
47.87 |
57.09 |
62.89 |
79.92 |
0 |
285.15 |
300.1 MB |
Code search
| Conc. |
req/s |
p50, ms |
p95, ms |
p99, ms |
max, ms |
Errors |
CPU, % of a core |
Peak memory |
| 1 |
38.95 |
25.58 |
27.56 |
28.97 |
30.3 |
0 |
51.3 |
57.3 MB |
| 2 |
48.65 |
41.14 |
44.1 |
45.89 |
48.8 |
0 |
65 |
58.9 MB |
| 4 |
53.25 |
74.86 |
83.79 |
88.77 |
94.01 |
0 |
71.7 |
78.5 MB |
| 8 |
54.2 |
145.16 |
177.7 |
195.68 |
234.33 |
0 |
71.6 |
187.4 MB |
Issue creation
| Conc. |
req/s |
p50, ms |
p95, ms |
p99, ms |
max, ms |
Errors |
CPU, % of a core |
Peak memory |
| 1 |
319.35 |
2.79 |
4.12 |
4.81 |
224.48 |
0 |
56.7 |
49.2 MB |
| 4 |
726.05 |
2.97 |
5.73 |
41.32 |
1263.54 |
0 |
102.75 |
112.8 MB |
| 16 |
1504.6 |
5.01 |
39.07 |
48.51 |
1501.04 |
0 |
214 |
223.9 MB |
| 64 |
3136.55 |
16.2 |
59.41 |
105.9 |
217.87 |
0 |
372.3 |
318.9 MB |
| 128 |
902.4 |
132.84 |
236.31 |
1143.34 |
1232.26 |
0 |
172.25 |
319.5 MB |
Clone (git clone)
| Conc. |
req/s |
p50, ms |
p95, ms |
p99, ms |
max, ms |
Errors |
CPU, % of a core |
Peak memory |
| 1 |
23.35 |
43.16 |
47.58 |
50.5 |
76.39 |
0 |
4.1 |
44.4 MB |
| 4 |
116.6 |
34.16 |
36.15 |
37.71 |
47.55 |
0 |
14.05 |
46.5 MB |
| 16 |
123.85 |
129.08 |
146.56 |
156.25 |
177.53 |
0 |
17.05 |
51.0 MB |
Push (git push)
| Conc. |
req/s |
p50, ms |
p95, ms |
p99, ms |
max, ms |
Errors |
CPU, % of a core |
Peak memory |
| 1 |
13.85 |
58.56 |
95.36 |
105.07 |
1606.45 |
0 |
9.15 |
48.4 MB |
| 4 |
73.15 |
47.86 |
74.64 |
397.85 |
604.15 |
0 |
45.5 |
107.9 MB |
| 16 |
120.35 |
131.72 |
164.75 |
180.27 |
209.09 |
0 |
112.7 |
208.1 MB |
What this means
| Claim |
Measured |
Verdict |
| Memory at idle — under 50 MB |
45.8 MB |
confirmed |
| Binary size — under 60 MB |
57.2 MB |
confirmed |
Under load memory reaches 320 MB — the ceiling across every step of every scenario, including code search and accepting a push, that is the worst case rather than the average.
 GitRiver